Today’s IT world is dominated by technologies such as Java, .NET, JavaScript, Python. Due to this fact, most Observability / APM vendors focus on the monitoring level improvement of these technologies.
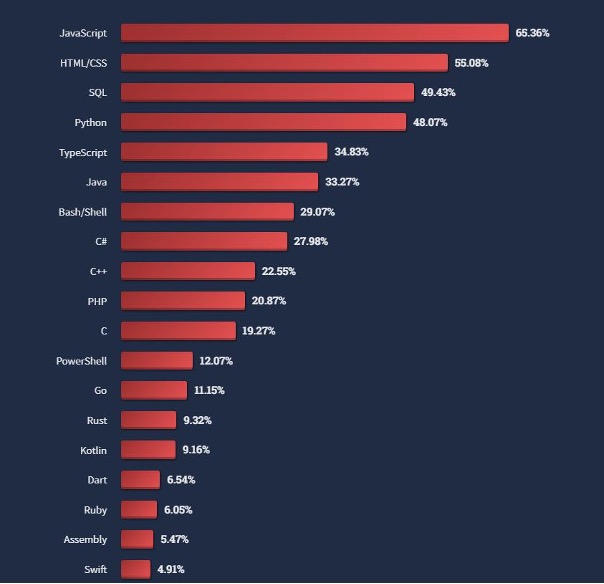
Image 1 - source https://www.monterail.com/blog/why-ruby-on-rails-development
According to the stats, presented on monterail.com, Ruby is not positioned as the top technology used worldwide. Based on the experience we have in Spica Solutions, there are some core or important systems written in Ruby. This language has many advantages such as easiness of connection to libraries written in C/C++. Nevertheless, it’s not the main point of interest for monitoring providers such as Dynatrace, Appdynamics, Newrelic, Datadog, Instana or Scout. Each of those vendors address Ruby instrumentation differently.
OpenTelemetry / OpenTracing
This path was picked by Dynatrace. Because of the internal decisions and evolution of OpenTelemetry, now there is dedicated agent for Ruby developed by Dynatrace. Because of how OpenTelemetry instrumentations work, there is a need for installing several packages and making some necessary changes in the application in order to configure where the collected telemetry data will be sent (via OneAgent or API). It’s not as easy as installing an agent for other technologies supported by Dynatrace. You also need to maintain several dependencies that must be updated and tested separately before each app deployment. This consumes resources and time.
Dedicated agent
This is the easiest way of deployment from the customer perspective. If the system is huge, instrumentation can be done and maintained much easier. Appdynamics, for example had a Ruby agent but development stopped some time ago and this technology is forgotten. They moved to OpenTelemetry direction, the same way as Dynatrace. Other mentioned vendors have own Ruby agents with different Ruby versions and technology support. The best support is provided right now by Instana because injection of the agent is done automatically like for other technologies. Vendors like NewRelic, Scout and Datadog need installation and configuration for operating. The above mentioned tools have no OnPrem versions, so for customers who cannot use SaaS solutions, these cannot be considered as an option. Dedicated agents are easier to maintain because we have only one binary we need to update and test.
Infrastructure monitoring based on metrics and Logs
Solutions such as ELK stack or Prometheus have integrations that allow to consume some data from the process. The problem with even the best monitoring based on logs and metrics, is that in a lot of cases you may not have enough input to troubleshoot the issue. This may need creating new log entries, new metrics, etc. From the maintenance perspective of a large company, it may be really cost consuming. Such solutions, in many cases are done by smart engineers and they need same level of knowledge to do troubleshooting. It’s much smarter to relay on technologies that have lower entry level to spread knowledge across the company.
Pros and Cons of other monitoring solutions that offer Ruby on Rails full stack monitoring
In the chapter below I’ve mentioned solutions that offer tracing and metrics collection for Ruby on Rails apps with some thoughts related to them.
NewRelic
NewRelic is a popular solution for Ruby on Rails monitoring. It offers auto instrumentation of Ruby processes after installing GEM that handles this process. Unfortunately, you need to provide a few extra configuration steps to make it work. This makes the process more complicated and time consuming. Level of supported technologies is really wide, but the quality of data is not so good because of data sampling. Another case is the licensing model that is calculated not only by agents but also by ingested data. If you have large microservice apps that generate a vast amount of atomic transactions, it will be definitely cost consuming. NewRelic is available only as SaaS solution. The huge disadvantage is the lack of support for nginx tracing which makes it impossible to see the performance between reverse proxy and Ruby apps. The monitoring of full stack solution in a company needs more effort to implement it due to the instrumentation process for other technologies. There are scripts that simplify the process, but they are recommended to be used during POV not as a permanent solution. When Business monitoring is considered then Newrelic is not a first choice solutions.
DataDog
This platform derives from unstructured data analysis and metrics. It’s great in this area. APM is something new for them. You need to remember about it when you think about the monitoring of wider than Ruby only. Because of that, data from logs and metrics are not tightly connected to traces which makes troubleshooting more complicated. It works best if it’s used across the whole company with all the features implemented. It makes this solution very expensive. In terms of Ruby instrumentation, Datadog provides a gem file that needs invocation in the code of app. That means the installation needs code changing. It also offers worse level of traces regarding to Ruby. In terms of business monitoring, DataDog has a really vast amount of possible data formats to ingest, so it can be adapted to these tasks as well. It’s problematic if you want to collect business data from traces.
Instana
This solution is interesting from the Ruby point of view because they implemented auto injection of Ruby instrumentation to their host agent. It means that you don’t need to install any 3rd party gem to your solution, which is awesome. The level of collected data is good. Instana also supports wide range of technologies which makes this solution a great competitor. From the implementation perspective, it is almost as easy as Dynatrace (host agent is auto instrumenting most of the supported technologies), but there are limitations related to dashboarding and business monitoring. If you need to ingest extra metrics, there are limitations as well. Instana is offered as SaaS and OnPrem solution.
AppDynamics
As I mentioned before, Appdymics had Ruby agent but support for this technology was dropped. The recommended way for the instrumentation is the use of OpenTelemetry which is not easy. I described the process before. If we think about using AppD across the whole company, we need to remember that OnPrem version of the solution is a few years behind SaaS version (only security fixes). This year, the company decided to change it, but it takes some time to catch up with what they have in SaaS. The deployment of OnPrem version is more complicated (a lot of components to deploy). Agents have no auto–injections so for large environments a vast number of manual steps may be needed. Nevertheless, it’s a great solution in terms of business and database monitoring. Traces are of good quality in general, but they are sampled so you will never see all traces in the controller. Ruby Open telemetry instrumentation is not as mature as dedicated agents, which is problematic for Dynatrace customers as well (not great visibility, number of steps needed to make it work).
Spica Solution Ruby Monitoring and why Dynatrace
Collection of telemetry data (tracing and metrics) is one thing. What we can achieve with those data is a different story. Right now, in terms of the easiness of deployment, technology support and data analytics, Dynatrace is a number one solution on the market. PurePath technology that is behind distributed traces provides answers about an end – to – end performance. One of the gaps Dynatrace has, is the lack of support for Ruby on Rails.
Other mentioned vendors have some limitations, such as lack of support for nginx monitoring (which is used widely as reverse proxy for Ruby) or has restriction in the number of collected traces per minute. They also have a different level of support for many other technologies that may exist in your company. Addressing one need may produce other gaps that need to be filled somehow. The decision about what tool should be implemented in the company cannot be driven only by a single technology support. We need to think much wider and consider this as long-term strategy for monitoring and not only addressing the current needs. When we think about observability across the whole technology stack, Dynatrace addresses it very well.
We have a customer that did this calculation and chose Dynatrace. Unfortunately, they had one of the core systems written in Ruby. We decided to address this following a few principles in our work:
- Instrumentation needs to be as easy as possible
- The level of data needs to be the same as for other technologies supported by
Dynatrace OneAgent
- Overhead for performance must be negligible
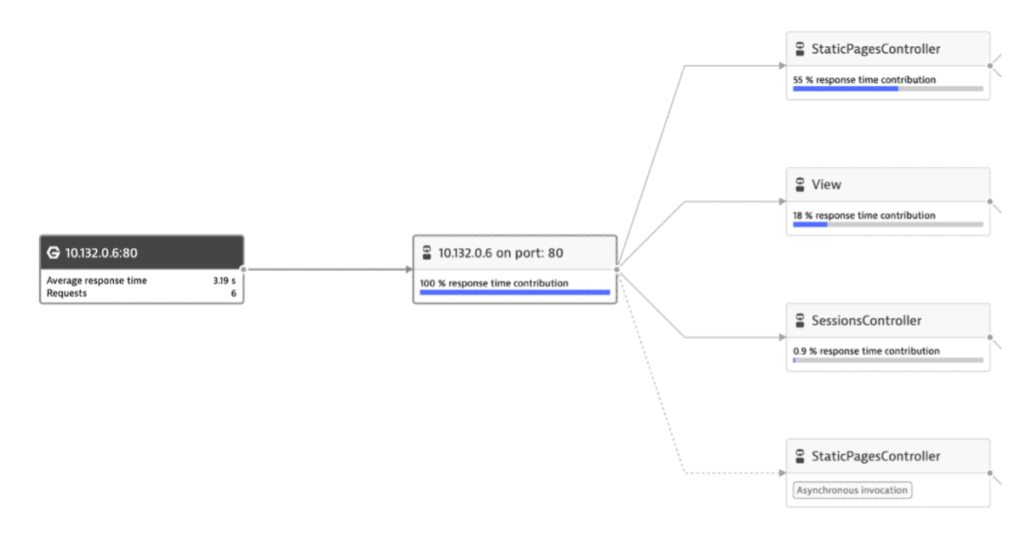
The result of our work is an agent written based on OneAgent SDK for C. We prepared own middleware between Ruby and C to limit the number of dependencies and make things more efficient. GEM is available on our repository or can be stored on the client internal one. It does not need any access to the Internet. The customer only needs to have OneAgent deployed in a full stack mode, deploy Ruby app with our GEM installed and provide only one environment variable with a license key. That’s it! You will see full distributed traces that goes through whole application stack monitored by Dynatrace without touching the code. It doesn’t matter if the app is standalone, containerized or is operated on K8s/OpenShift environment. As long you have OneAgent deployed on your system, traces will be collected like for any other technology.
For the time being, our agent supports Ruby from version 1.9 and above and offers instrumentation for:
- Incomming webrequests
- Controllers and actions
- View generation
- External communication (WebRequests) with transaction tagging
- Communication with the database and its detection
- Capturing headers (Request and Response)
- Communication with Redis
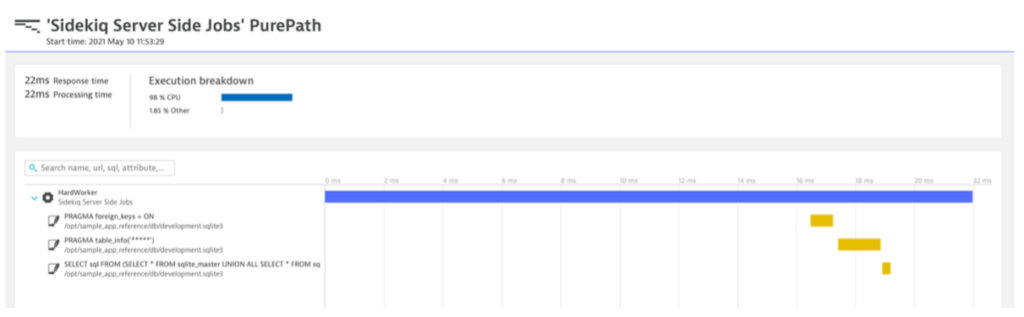
- Sidekiq
- Exception collection
- Ability to instrument code from optional agent configuration
- Early Access support for Kafka and RabbitMQ requests tracing
- Collecting thread metrics and Garbage Collector work in Ruby
This is more than enough to have a good insight into your application and to collect useful traces.
We work with customers on many projects related to deep analysis and instrumentation. Therefore, we understand why it’s so important to have option of instrumentation custom code. Smart instrumentation should not produce overhead. We decided to concentrate on the most important points of apps (same as Dynatrace for their agents) and we left a door open for additional instrumentation without the need of changing the application code. You just need to put path to models / classes / methods you want to instrument into environment variable and restart your app. After that you will see the instrumented elements as a new Custom Service visible in call stack. You can see all traces in detail from your Ruby on Rails systems in top Observability solution.
We didn’t want to provide only traces. Therefore, we decided to implement a collection of metrics as well as from the inside of Ruby process and send them to Dynatrace. Right now, you have everything you need to explore the performance of your Ruby on Rails application.
On the top of those goods AI always watches your environment to give you the answers you need in order to focus on business, not on fixing the bugs. Can we do better?
Extending agent and our Road Map
Our team is open for extending agent to address the customer needs. If there is a missing support for GEM you use, don’t hesitate to tell us about it. We can provide hooks for auto instrumentation that will give visibility instantly and then prepare native support for this technology. Our team is focused on the value and does our best to delivers support as quickly as possible. Our satisfied customers that are the proof of it.
Pararelly to the existing agent that uses OneAgent SDK for C, we are working on an agent that will use OpenTelemetry, based on the same principles we had initially. It must be easy to use and offer the same performance and level of data. It will work with Dynatrace even without OneAgent deployment because the traces can be delivered via API.
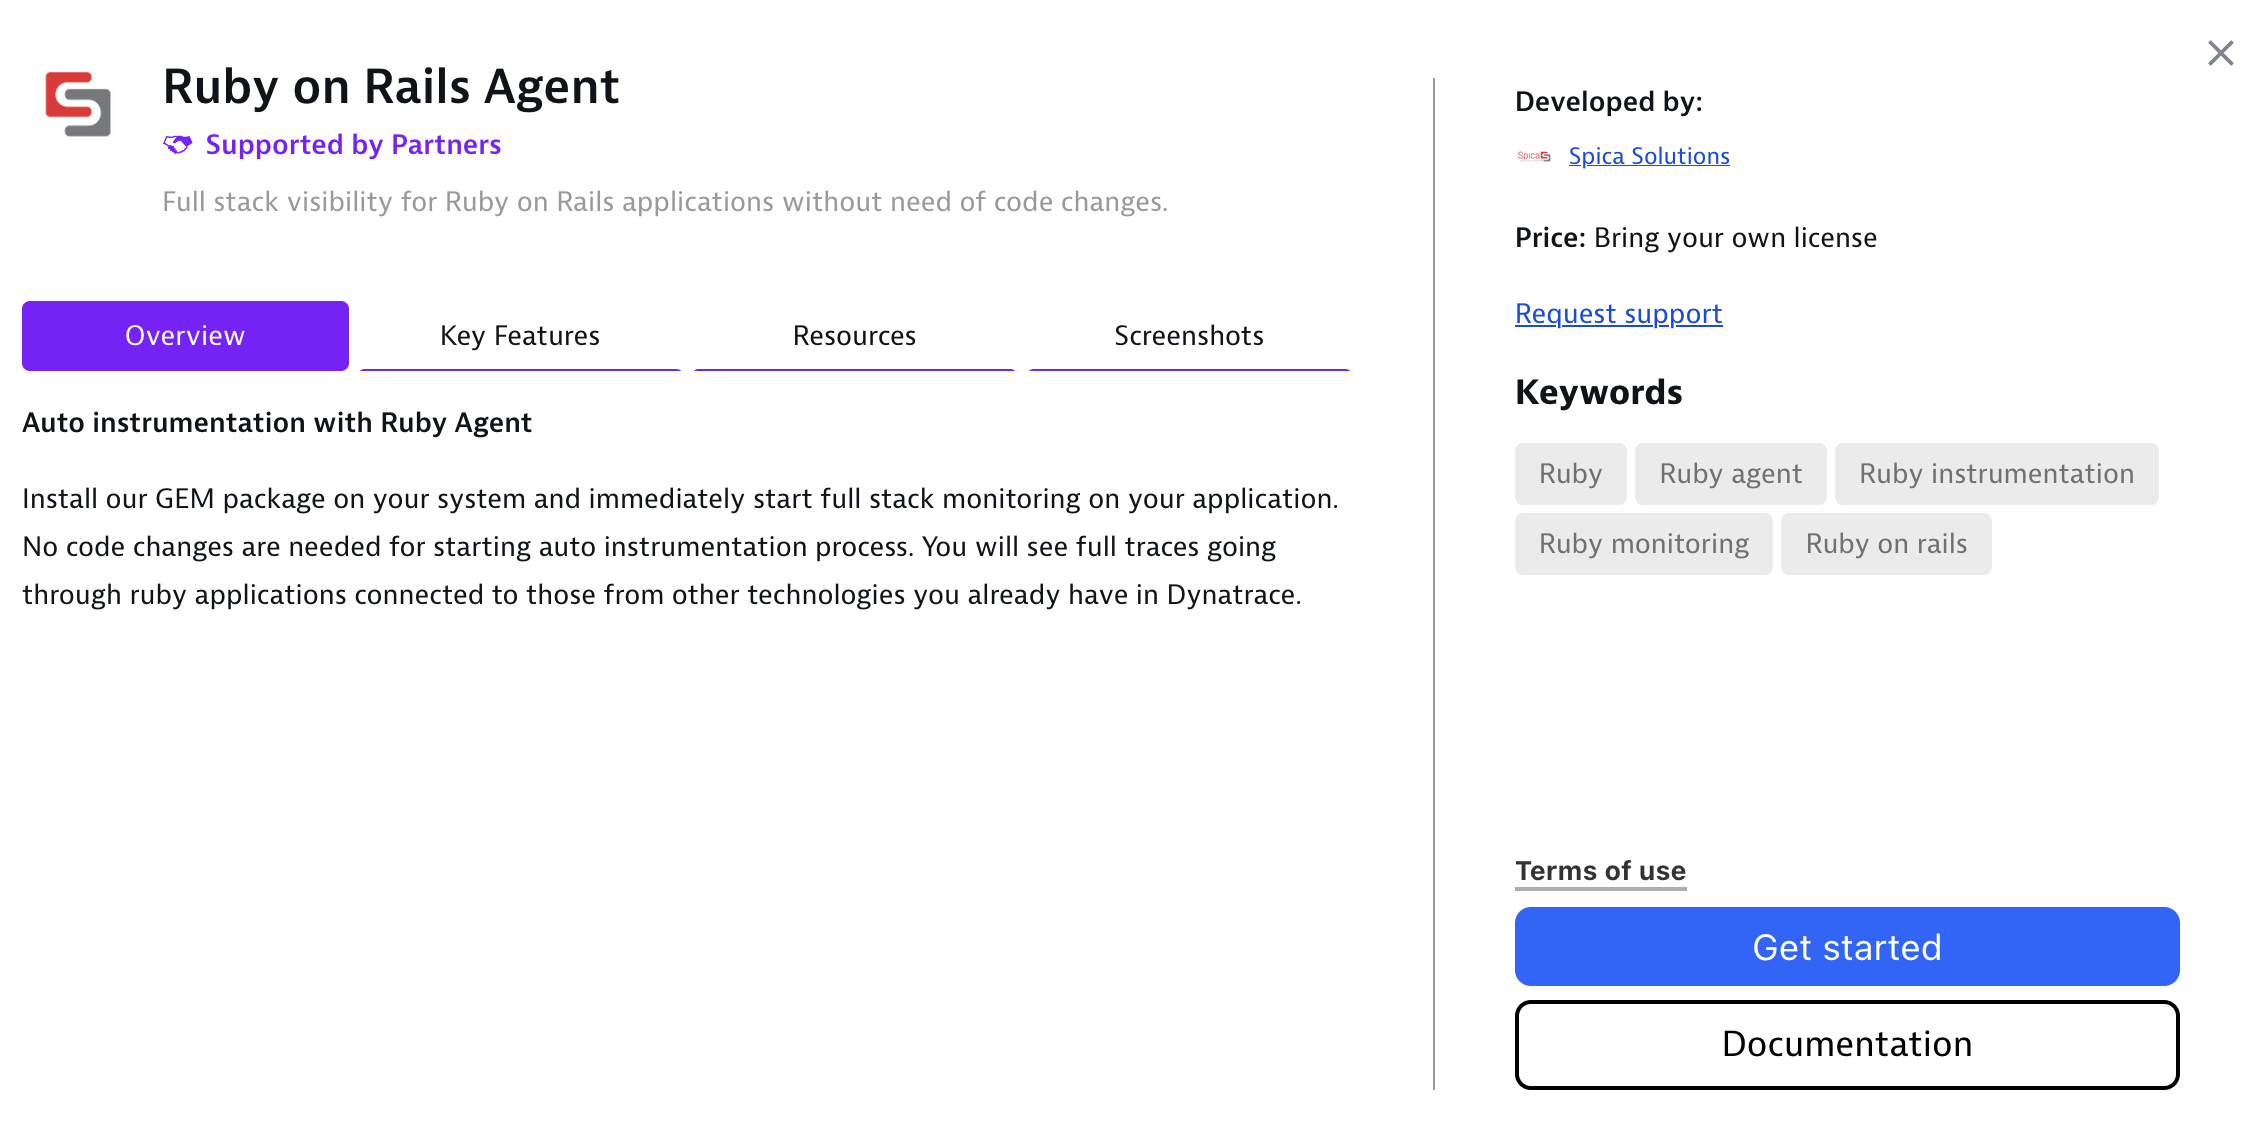
Spica Solutions Ruby on Rails agent is available in Dynatrace HUB

You can find documentation there and the contact information to our sales team. Do you need POV of Dynatrace with Ruby on Rails? We are ready for this exciting journey across your systems. How about you?